Refurbished Gaming PCs & Laptops
Showing all 6 resultsSorted by price: low to high
-

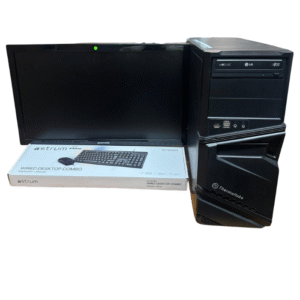
“Baby Grinder 1 ” Gaming PC | Intel Core i5- 4590@3.0GB | Gigabyte H81 MBT | 16GB DDR3 RAM | 256GB SSD & 1TB Sata | Gigabyte GV-N710 1 gig GPU | Windows 10 Pro
R3,499.00 -
Baby Grinder 1 Gaming PC | Intel Core i5-4590@3.0GB | Gigabyte H81 MBT | 16GB DDR3 RAM | 256GB SSD & 1TB Sata | Gigabyte GV-N710 1GB | Windows 10 Pro
R4,499.00 -

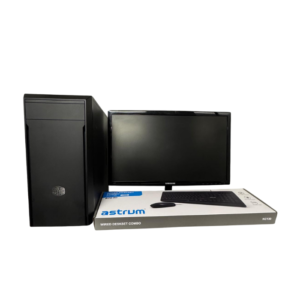
Avenger 2C Gaming PC | Intel Core i7-6700@3.0GHz | Gigabyte GA-H110-S2PH | 16GB DDR4 Ram | GTX 1660 Super | 256GB SSD & 1TB SATA | Windows 11 Pro
R8,199.00 -
Avenger 2C Gaming PC | Intel Core i7-6700@3.0GHz | AFOX B250 (MBT) | 16GB DDR4 Ram| Asus RX 5700 strix 8GB | 512GB SSD & 1TB Sata | Windows 11 Pro
R8,999.00 -
Avenger 2C Gaming PC | Intel Core i7 -6700@3.0GHz | 16GB DDR4 Ram | Gigabyte H110 MBT | Gigabyte GTX 1660 Super (GPU) | 256GB SSD & 1TB SATA | Windows 11 Pro
R9,860.00 -

Avenger 2C | Intel Core i7-6700@3.0GHz | AFOX B250 (MBT) | 16GB DDR4 Ram| Asus RX 5700 8GB | 512GB SSD & 1TB Sata | Windows 11 Pro
R9,999.00
Not Sure How Different Graphics Cards Compare in Performance?
Have a look at a comparison chart built off of well known benchmarks here